

Primary industry producers are able to use the review of recent climate indicators, including El Niño Southern Oscillation, the Indian Ocean Dipole, the Southern Annular Mode, as well as local sea surface temperature and pressure systems to make more informed business decisions.
The Seasonal Climate Outlook newsletter also provides up-to-date maps on rainfall totals, rainfall deciles and modelled soil water.
It’s free to subscribe to any of our electronic newsletters and you can unsubscribe at any time.
Previous editions
- December 2025
- November 2025
- October 2025
- September 2025
- August 2025
- July 2025
- June 2025
- May 2025
- April 2025 (568 KB)pdf
- March 2025 (507 KB)pdf
- February 2025 (544 KB)pdf
- January 2025 (391 KB)pdf
- December 2024 (596 KB)pdf
- November 2024 (885 KB)pdf
- October 2024 (781 KB)pdf
- September 2024 (895 KB)pdf
- August 2024 (744 KB)pdf
- July 2024 (527 KB)pdf
- June 2024 (565 KB)pdf
- May 2024 (640 KB)pdf
- April 2024 (410 KB)pdf
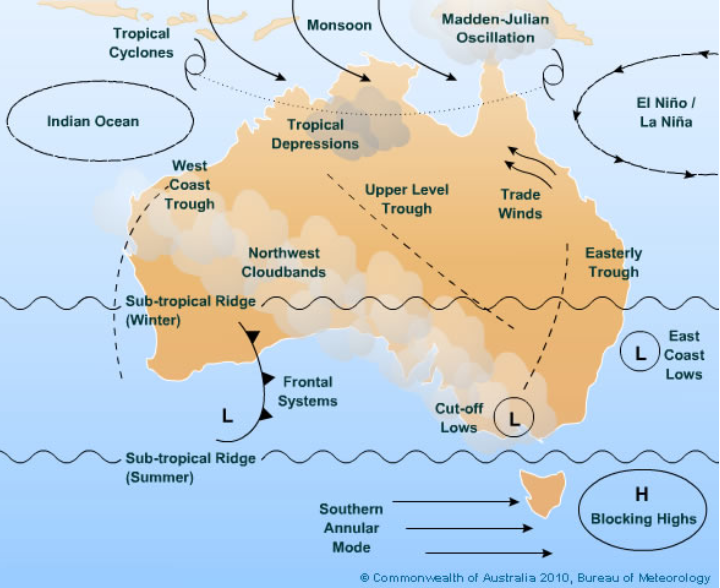
Climate drivers of the South West Land Division
The climate of the south-west of Western Australia and the Western Australian grainbelt (termed together as the South West Land Division (SWLD)) is influenced by many global and local climate drivers (Figure 1).
The below information provides detail on these drivers, where they are located on the globe, their impacts and their predictability. The climate of the SWLD is influenced by a number of global and local climate drivers and the four main drivers are detailed in Table 1.
|
Climate driver |
What is it? |
Influence on rainfall |
|
A band of high-pressure systems across the southern hemisphere mid-latitudes. Its position moves north and south with the seasons.
|
From November to April, it is generally south of Australia and can block rain-bearing cold fronts for days or weeks at a time. During winter (June to August), it moves north, allowing cold fronts and moist westerly air to bring rainfall to the SWLD. |
|
|
The difference in sea surface temperatures between the western and eastern tropical Indian Ocean. It has 3 phases: positive, neutral and negative.
|
Positive: generally, less rainfall during winter and spring. Negative: generally, more rainfall during winter and spring. Neutral: little influence on rainfall. IOD events typically develop from May or June, peak between August and October and decay by December. |
|
|
The north–south movement of the belt of strong westerly winds that circles Antarctica. These winds influence the movement of cold fronts across southern Australia.
|
Negative: generally, more rainfall in the SWLD during winter as the westerly winds and cold fronts move further north. Positive: generally, less rainfall as the westerly winds and cold fronts shift south towards Antarctica. The influence is strongest during winter. |
|
|
A climate pattern involving changes in sea surface temperatures and atmospheric pressure across the tropical Pacific Ocean. It has 3 phases: El Niño, neutral and La Niña.
|
ENSO has a relatively limited influence on SWLD rainfall compared with the IOD. However, El Niño can contribute to below-average winter and spring rainfall, while La Niña can favour wetter conditions. These effects can be influenced by other climate drivers, particularly the IOD. |
The subtropical ridge is a belt of high pressure that encircles the globe in the middle latitudes and forms part of the global atmospheric circulation (Figure 2). Its position plays an important role in influencing Australia's weather patterns and how they vary throughout the seasons.
During the warmer half of the year (November to April), the subtropical ridge is generally located south of southern Australia. High-pressure systems, also known as anticyclones, typically move eastwards along the ridge. These systems are associated with descending air, which suppresses cloud formation and rainfall, bringing generally stable and dry conditions. The ridge also tends to restrict the movement of cold fronts across southern Australia. Any fronts that do penetrate the ridge are generally weaker, bringing less rainfall and less intense changes in temperature and wind than those experienced during winter.
During autumn (March to May), the subtropical ridge gradually moves northwards, reaching central Australia as winter (June to August) approaches. For much of the colder half of the year (May to October), the ridge is positioned over the Australian continent. This northward movement allows cold fronts and associated low-pressure systems to extend further into southern Australia. These winter systems typically bring cooler south-westerly winds, increased cloud cover and showery rainfall.
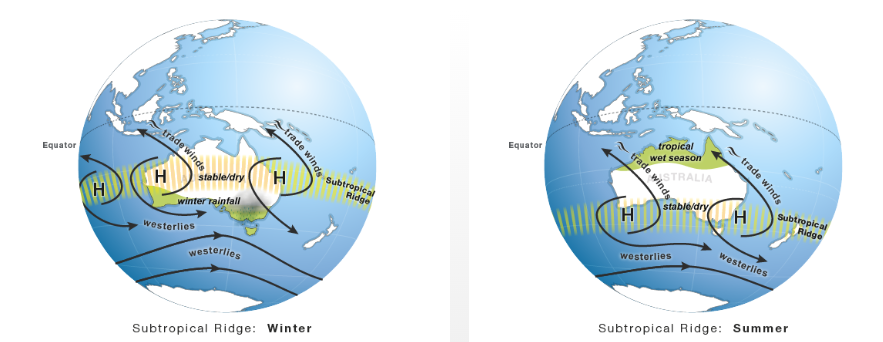 Figure 2. The subtropical ridge in the southern hemisphere is located across a belt of high-pressure systems over Australia. In winter, it moves north of the SWLD, allowing cold fronts to move across the region and bring rainfall. In summer, it shifts south of the SWLD, restricting the movement of cold fronts and resulting in generally drier conditions. Source: Bureau of Meteorology.
The Indian Ocean Dipole (IOD) is defined by the difference in sea surface temperatures (SSTs) between 2 regions, or poles, of the Indian Ocean: a western pole in the Arabian Sea and western Indian Ocean, and an eastern pole in the eastern Indian Ocean, south of Indonesia. The IOD influences the climate of Australia and other countries surrounding the Indian Ocean and is an important contributor to rainfall variability across the region.
The IOD is one of the key drivers of Australia's climate and can have a significant impact on agriculture, as IOD events generally coincide with the winter cropping season. The IOD is typically active between May and November and has 3 phases: neutral, positive and negative. Events usually develop around May or June, peak between August and October, and rapidly decay with the arrival of the southern hemisphere monsoon, usually around November or December.
During a positive IOD (Figure 3), SSTs around Indonesia are cooler than average, while those in the western Indian Ocean are warmer than average. This temperature difference strengthens easterly winds across the tropical Indian Ocean and reduces cloud formation and convection near Australia. As a result, rainfall is generally suppressed across southern and central Australia, increasing the likelihood of below-average rainfall in the SWLD. Rainfall during positive IOD events is often in the lower deciles (deciles 3–4) across the SWLD.
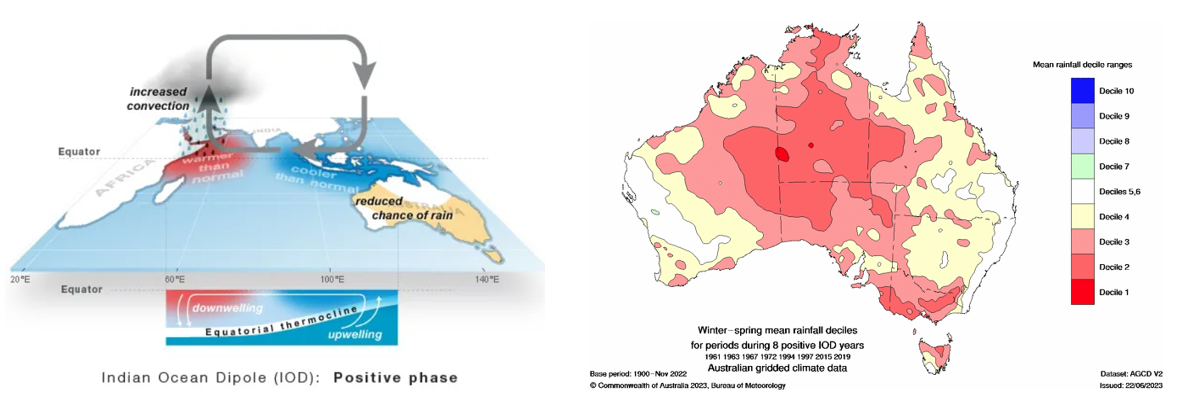
Figure 3. Diagram showing the positive phase of the Indian Ocean Dipole. The winter-spring (June to November) mean rainfall decile for the SWLD in a positive IOD phase is 2-3. Source: Bureau of Meteorology.
Conversely, during a negative IOD (Figure 4), SSTs are warmer than average near Indonesia and cooler than average in the western Indian Ocean. This temperature pattern strengthens westerly winds across the tropical Indian Ocean, promotes increased cloud formation and convection near Australia, and generally favours above-average rainfall across parts of southern Australia. In particular, the eastern Wheatbelt may experience higher than average rainfall due to an increased frequency of rain-bearing cloud bands.
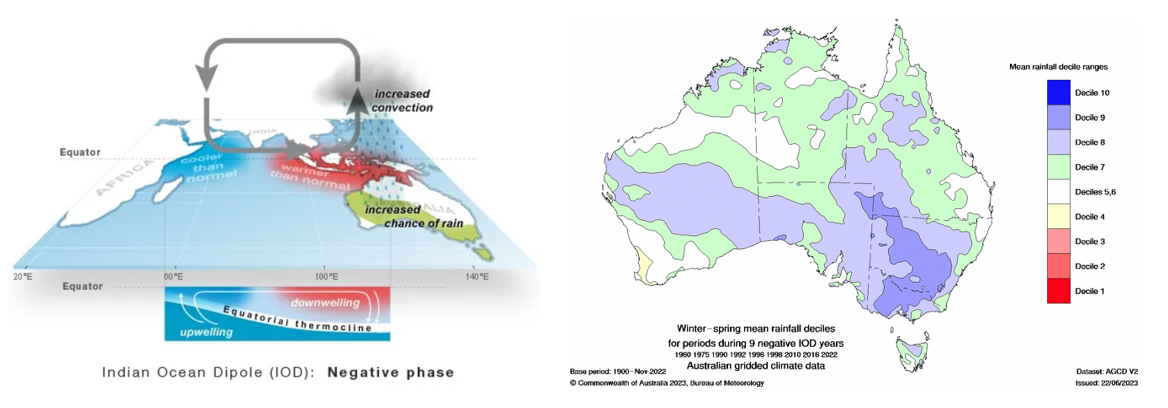
Figure 4. Diagram showing the negative phase of the Indian Ocean Dipole. The winter-spring (June to November) mean rainfall decile for the SWLD in a negative IOD phase is 4-6. Source: Bureau of Meteorology.
The Southern Annular Mode (SAM), also known as the Antarctic Oscillation, is a pattern of climate variability that influences weather across southern Australia. It describes the north–south movement of the belt of strong westerly winds that circles Antarctica. These winds are associated with storm systems and cold fronts that generally move from west to east across southern Australia. Changes in the position of this wind belt can influence rainfall, wind and temperature.
During a positive SAM event (Figure 5), the belt of strong westerly winds contracts towards the South Pole. This results in weaker than normal westerly winds, easterly wind anomalies and higher-than-normal pressure across much of southern Australia. In summer, a positive SAM event has no influence on SWLD rainfall. During winter, these conditions tend to reduce the frequency of cold fronts reaching the SWLD, resulting in reduced rainfall for the majority of the SWLD, but more rain for Esperance.
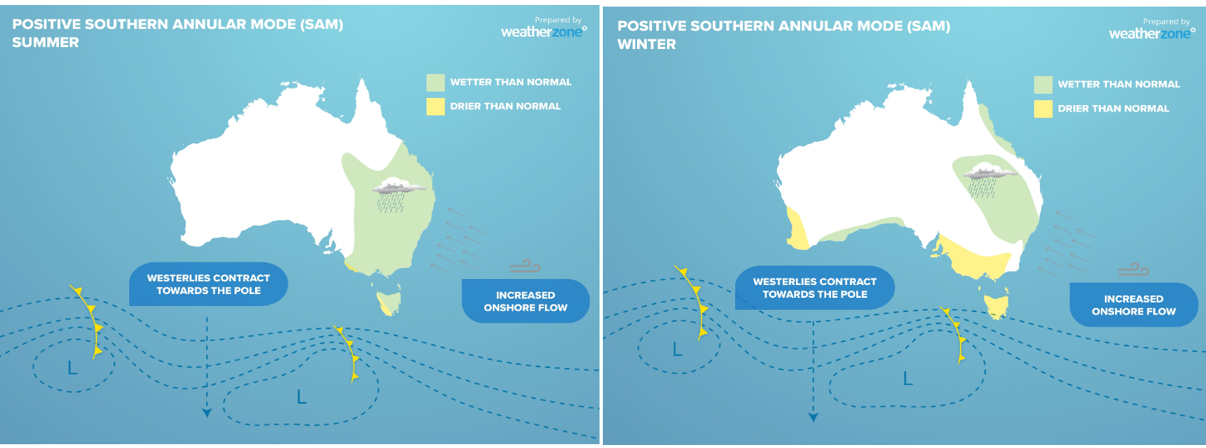
Figure 5. A positive Southern Annular Mode (SAM) causes the belt of strong westerly winds and associated cold fronts to shift southwards towards Antarctica. During summer, this generally has little influence on rainfall across the SWLD. However, during winter, a positive SAM typically reduces rainfall across much of the SWLD, although parts of the south coast, including Esperance, can experience increased rainfall. Source: Weather Zone.
Conversely, during a negative SAM event (Figure 6), the belt of strong westerly winds expands northwards towards the equator. This brings the westerly winds and associated storm systems further north, generally resulting in more frequent cold fronts and lower pressure over the SWLD during winter. This tends to favour increased rainfall.
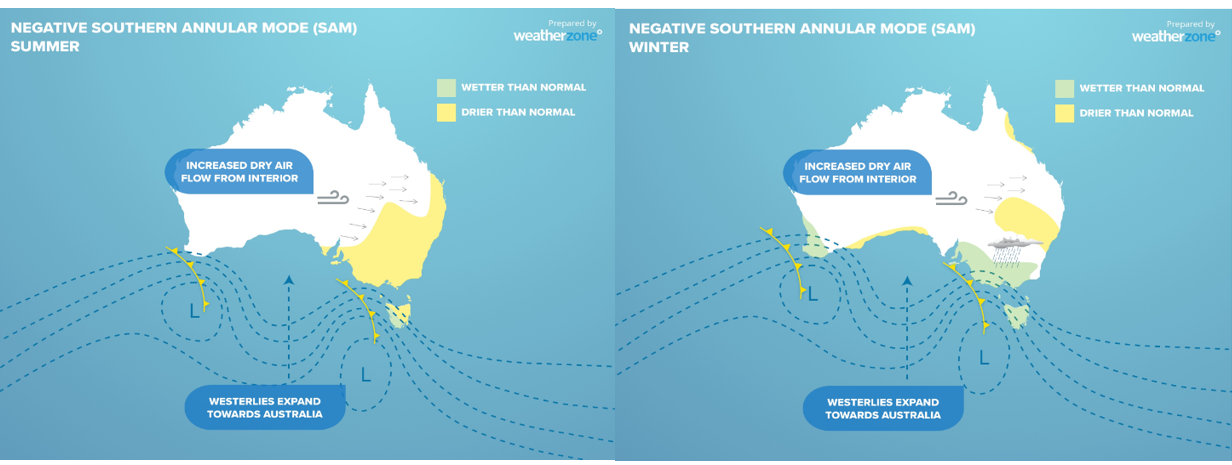
Figure 6. A negative Southern Annular Mode causes westerly winds and cold fronts expand towards Australia. In summer, this has no influence on SWLD rainfall, but in winter a negative SAM means more rainfall for the majority of the SWLD and less rain for Esperance. Source: Weather Zone.
Since 1979, positive SAM events have been more frequent than negative events during winter. SAM has been estimated to account for around 10–15% of weekly rainfall variability in south-west Western Australia, making its influence comparable to, or greater than, that of the El Niño – Southern Oscillation (ENSO). However, its influence varies depending on the season and location.
SAM generally has little influence on summer rainfall across south-west Western Australia. During spring, a positive SAM can contribute to wetter conditions along the south coast, including around Esperance. In contrast, a negative SAM generally has little influence on spring and summer rainfall across the SWLD.
The El Niño–Southern Oscillation (ENSO) is a large-scale ocean–atmosphere phenomenon involving changes in sea surface temperatures (SSTs) in the central and eastern tropical Pacific Ocean, and changes in atmospheric pressure across the Pacific. The Southern Oscillation Index (SOI), which measures the difference in atmospheric pressure between Tahiti and Darwin, is used to monitor the atmospheric component of ENSO. The Niño 3.4 region in the central equatorial Pacific is commonly used to monitor changes in ocean temperatures (Figure 7).
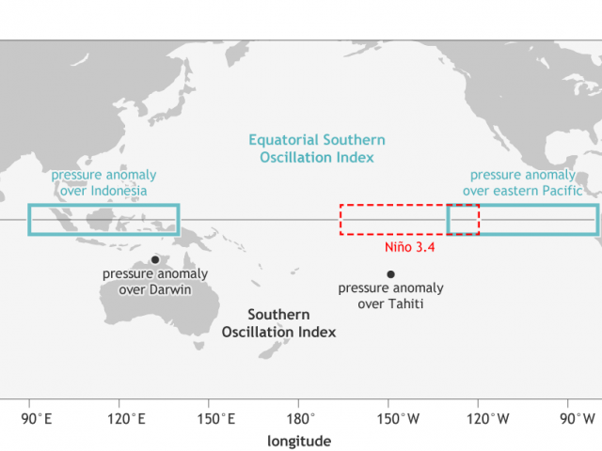
Figure 7. Location of Niño 3.4 area in the Pacific Ocean and the Southern Oscillation Index of Darwin and Tahiti.
ENSO has 3 phases: El Niño, neutral and La Niña. El Niño is characterised by warmer than average SSTs in the central and eastern tropical Pacific, generally accompanied by a negative SOI (below −7). La Niña is characterised by cooler than average SSTs in these regions, generally accompanied by a positive SOI (above +7). Neutral conditions occur when neither El Niño nor La Niña is established.
El Niño and La Niña events typically develop during autumn or early winter, strengthen during winter and spring, and begin to decay during summer, generally returning to neutral conditions by the following autumn. Events normally last around a year, although they can be shorter or persist for considerably longer. El Niño events typically occur every 3–5 years, while La Niña events occur every 3–7 years.
El Niño is generally associated with an increased likelihood of below-average rainfall across eastern and northern Australia, particularly during winter and spring (Figure 8). It can also contribute to drought conditions in these regions. However, its influence on rainfall in the South West Land Division (SWLD) is relatively limited compared with other climate drivers, particularly the Indian Ocean Dipole (IOD).
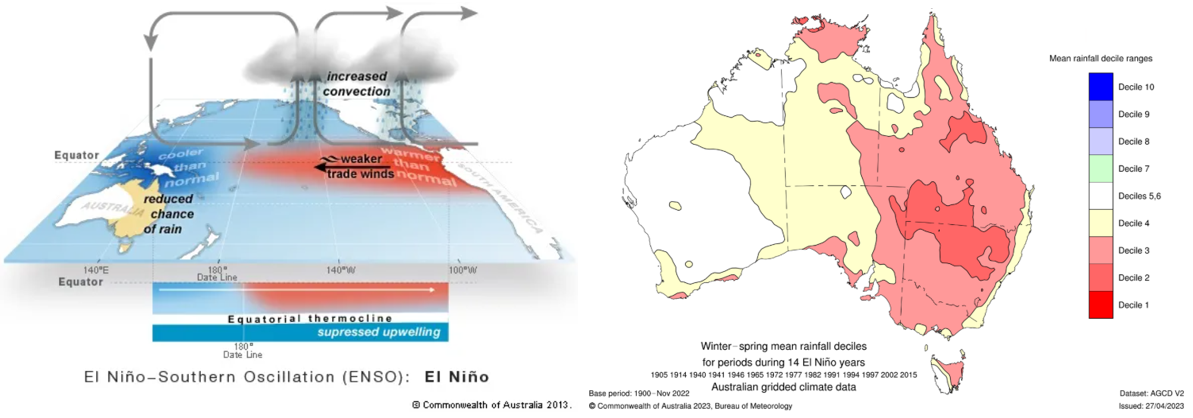
Figure 8. Diagram showing the El Niño with warmer than normal sea surface temperatures in the Pacific Ocean. The winter-spring (June to November) mean rainfall decile for the SWLD in a El Niño is 3-6. Source: Bureau of Meteorology.
Conversely, La Niña increases the likelihood of above-average rainfall across much of eastern and northern Australia (Figure 9). Its influence on rainfall in the SWLD is also relatively limited, although it can contribute to wetter conditions in some years. The greatest influence of La Niña on Australian rainfall generally occurs during winter, spring and early summer.
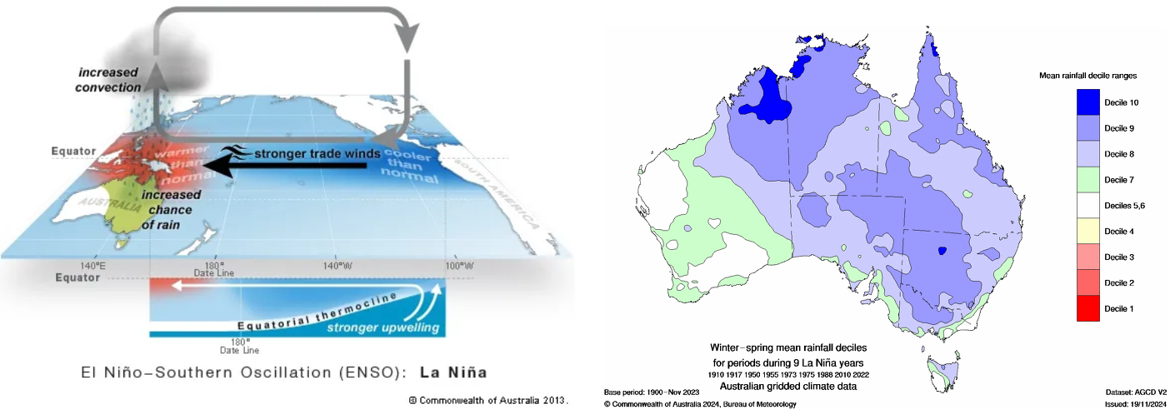
Figure 9. Diagram showing the La Niña with cooler than normal sea surface temperatures in the Pacific Ocean. The winter-spring (June to November) mean rainfall decile for the SWLD in a La Niña is 5-7. Source: Bureau of Meteorology.
Research by Risbey et al. (2009) examined the relationship between different climate drivers and seasonal rainfall across the SWLD (Figure 10). Their findings show that the influence of individual climate drivers varies depending on the season and location.
During summer (December to February), SAM was the main climate driver influencing rainfall across the SWLD, while the Southern Oscillation Index (SOI) also influenced rainfall along the south-west coast. In autumn (March to May), atmospheric blocking, associated with the subtropical ridge, was the dominant influence on rainfall.
During winter (June to August), SAM was the main influence on rainfall across the northern grainbelt, while atmospheric blocking had a greater influence across the Great Southern and Esperance regions. In spring (September to November), the main climate drivers influencing rainfall included the IOD, SOI and the position of the subtropical ridge.
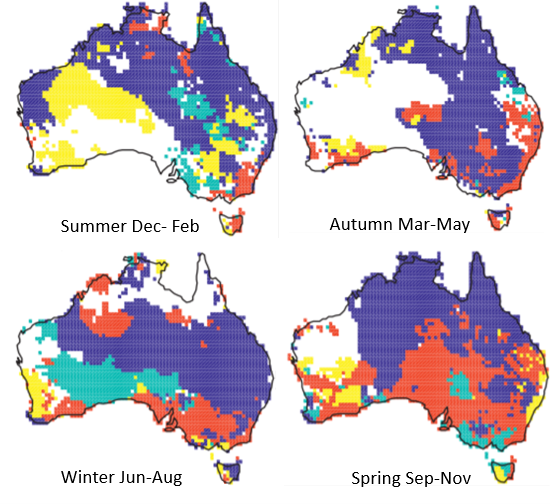
Figure 10. Main climate drivers for seasonal rainfall in Australia.: red- atmospheric blocking, yellow - southern annular mode, green - Indian Ocean Dipole, blue - Southern Oscillation Index. From Risbey JS, Pook MJ, McIntosh PC, Wheeler MC Hendon HH 2009, On the remote drivers of rainfall variability in Australia. American Meteorological Society.
When ENSO and the Indian Ocean Dipole (IOD) occur together, their combined influence on Australian climate can be amplified. For example, when El Niño coincides with a positive IOD, the two climate drivers can reinforce each other, increasing the likelihood of below-average rainfall across southern and eastern Australia, particularly during winter and spring. Conversely, La Niña occurring alongside a negative IOD can reinforce wetter conditions across parts of Australia. However, the strength of their combined influence varies between events and regions (Figure 11.)
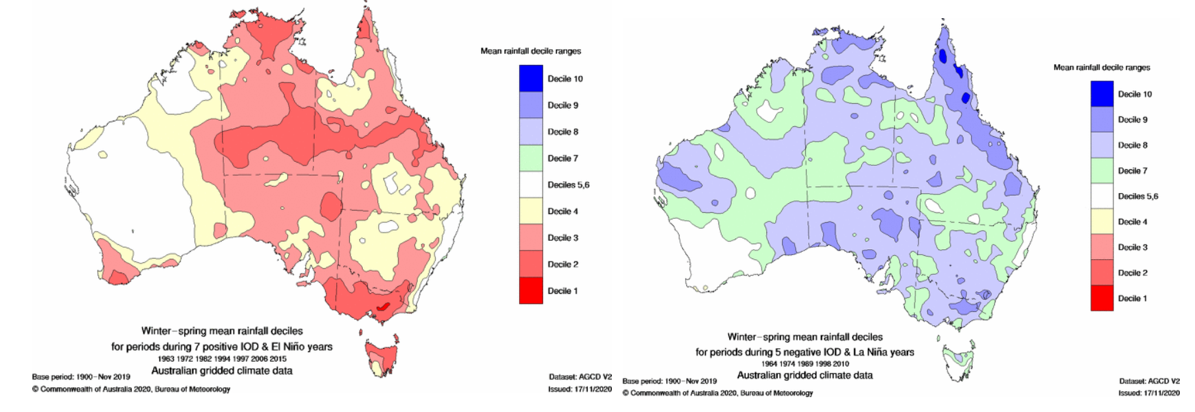
Figure 11. Winter – spring (June to November) mean rainfall maps for positive IOD and El Nino indicating that generally rainfall is decile 2-4 for the SWLD, and decile 5-6 in a negative IOD and La Niña event.
Further information
For more information on climate drivers see Research Updates Paper: Investigating the impact of ENSO and IOD on the South West Land Division